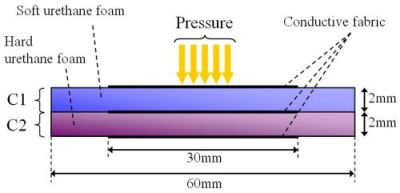
Fig.1 Cross-section of sensor element.
The soft and hard layers are 2 mm in thickness,
and the side length of the conductive piece is 3 cm.
We measure the capacitances C1 and C2.

 |
Fig.1 Cross-section of sensor element. The soft and hard layers are 2 mm in thickness, and the side length of the conductive piece is 3 cm. We measure the capacitances C1 and C2. 
| ||

|
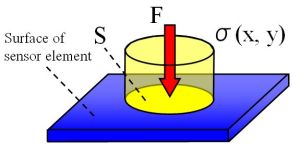
Fig.2 Supposed surface stress distribution. We suppose a constant surface stress distribution σ loaded to the surface of the sensor element verticallyin a contact field S. Parameters that we want to obtain are F and S. 
| ||

|
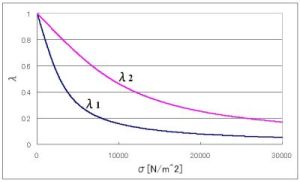
Fig.3 Nonlinear elasticity. Urethane foam has its displacement limit because it is very soft (Young's modulus and Poisson's ratio are small). We assume that the nonlinear elasticity of urethane foam is the entropy elasticity* expressed as  . .The soft layer (λ1) is easily compressed to its displacement limit. | ||

|
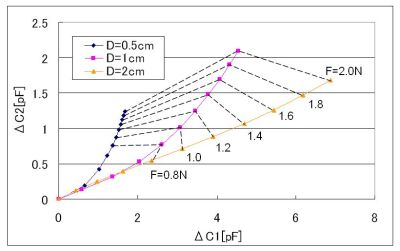
Fig.4 Result of simulation (Capacitance variations). Owing to the nonlinear elasticity and the hardness difference, (ΔC1, ΔC2)s draw trajectories which vary with D. And the larger F becomes, the larger the distance between the origin point and (ΔC1, ΔC2) is. By mapping from (ΔC1, ΔC2) to (F, S) in advance, we can obtain F and S simultaneously. (D means the diameter of the circular area S.) | ||